
recording music
data visualization in the form of an infographic depicting self-collected data of music and play time over the course of 14 days.
typography

colour pallete


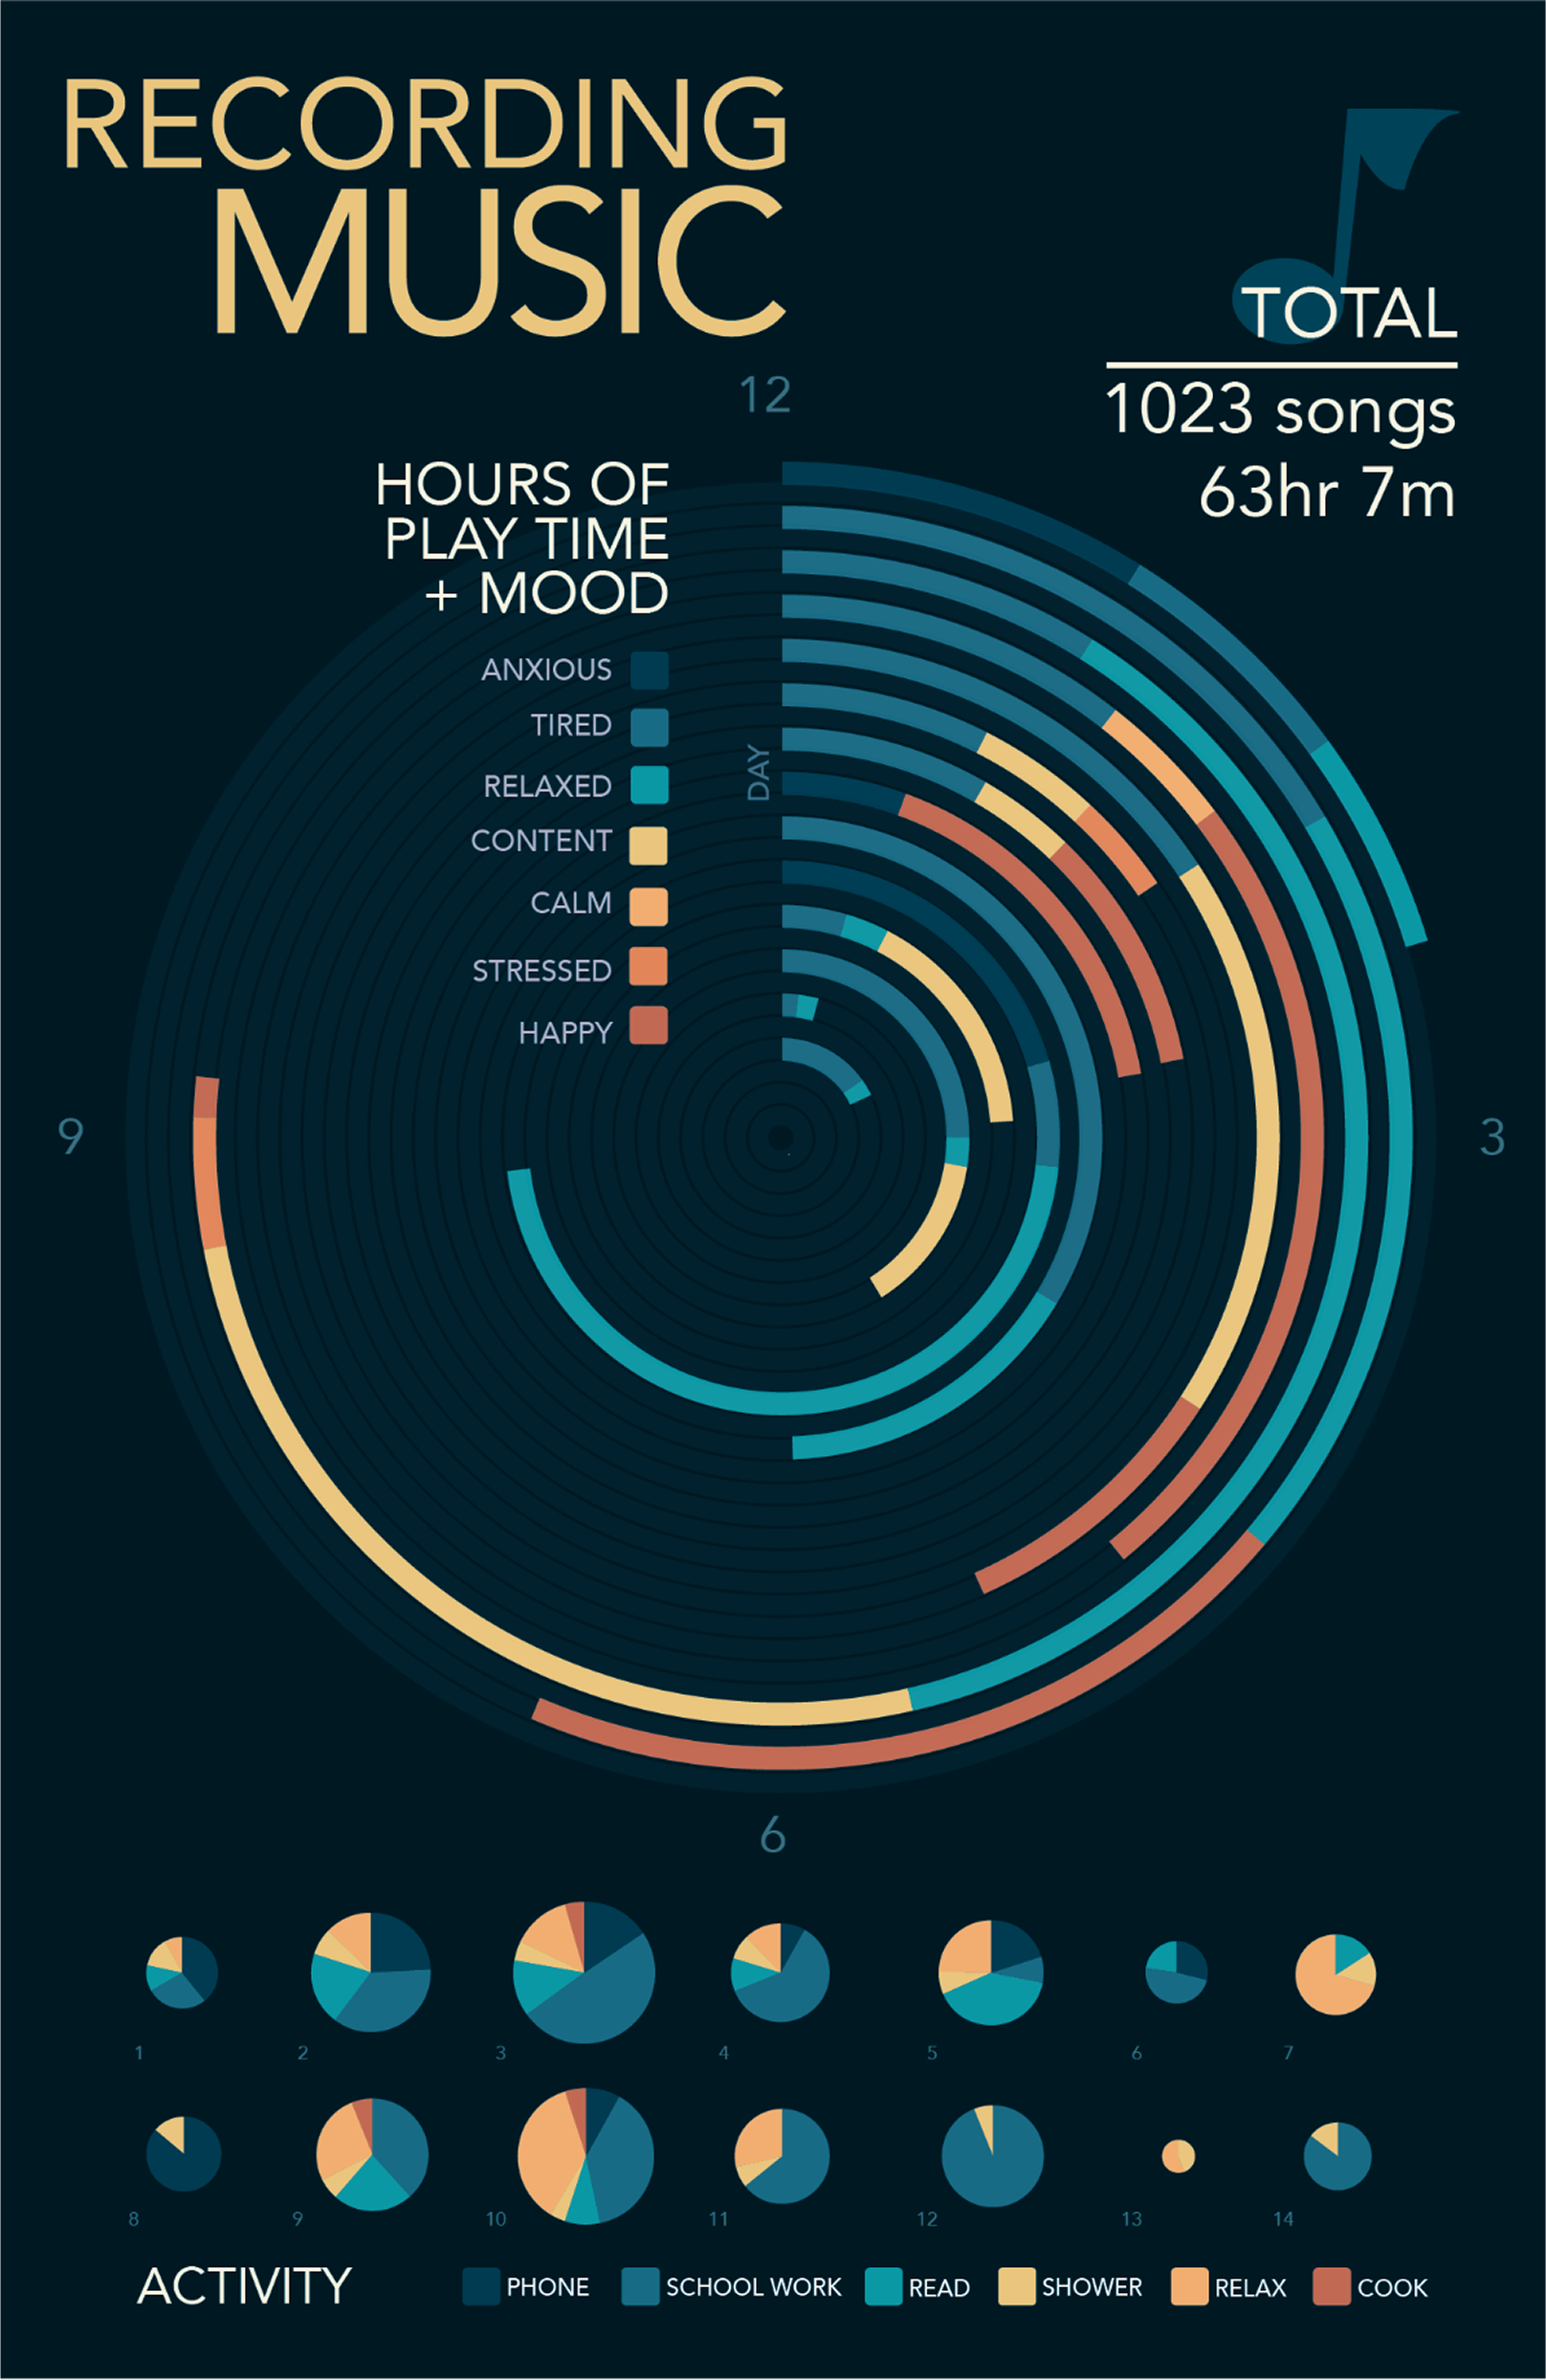
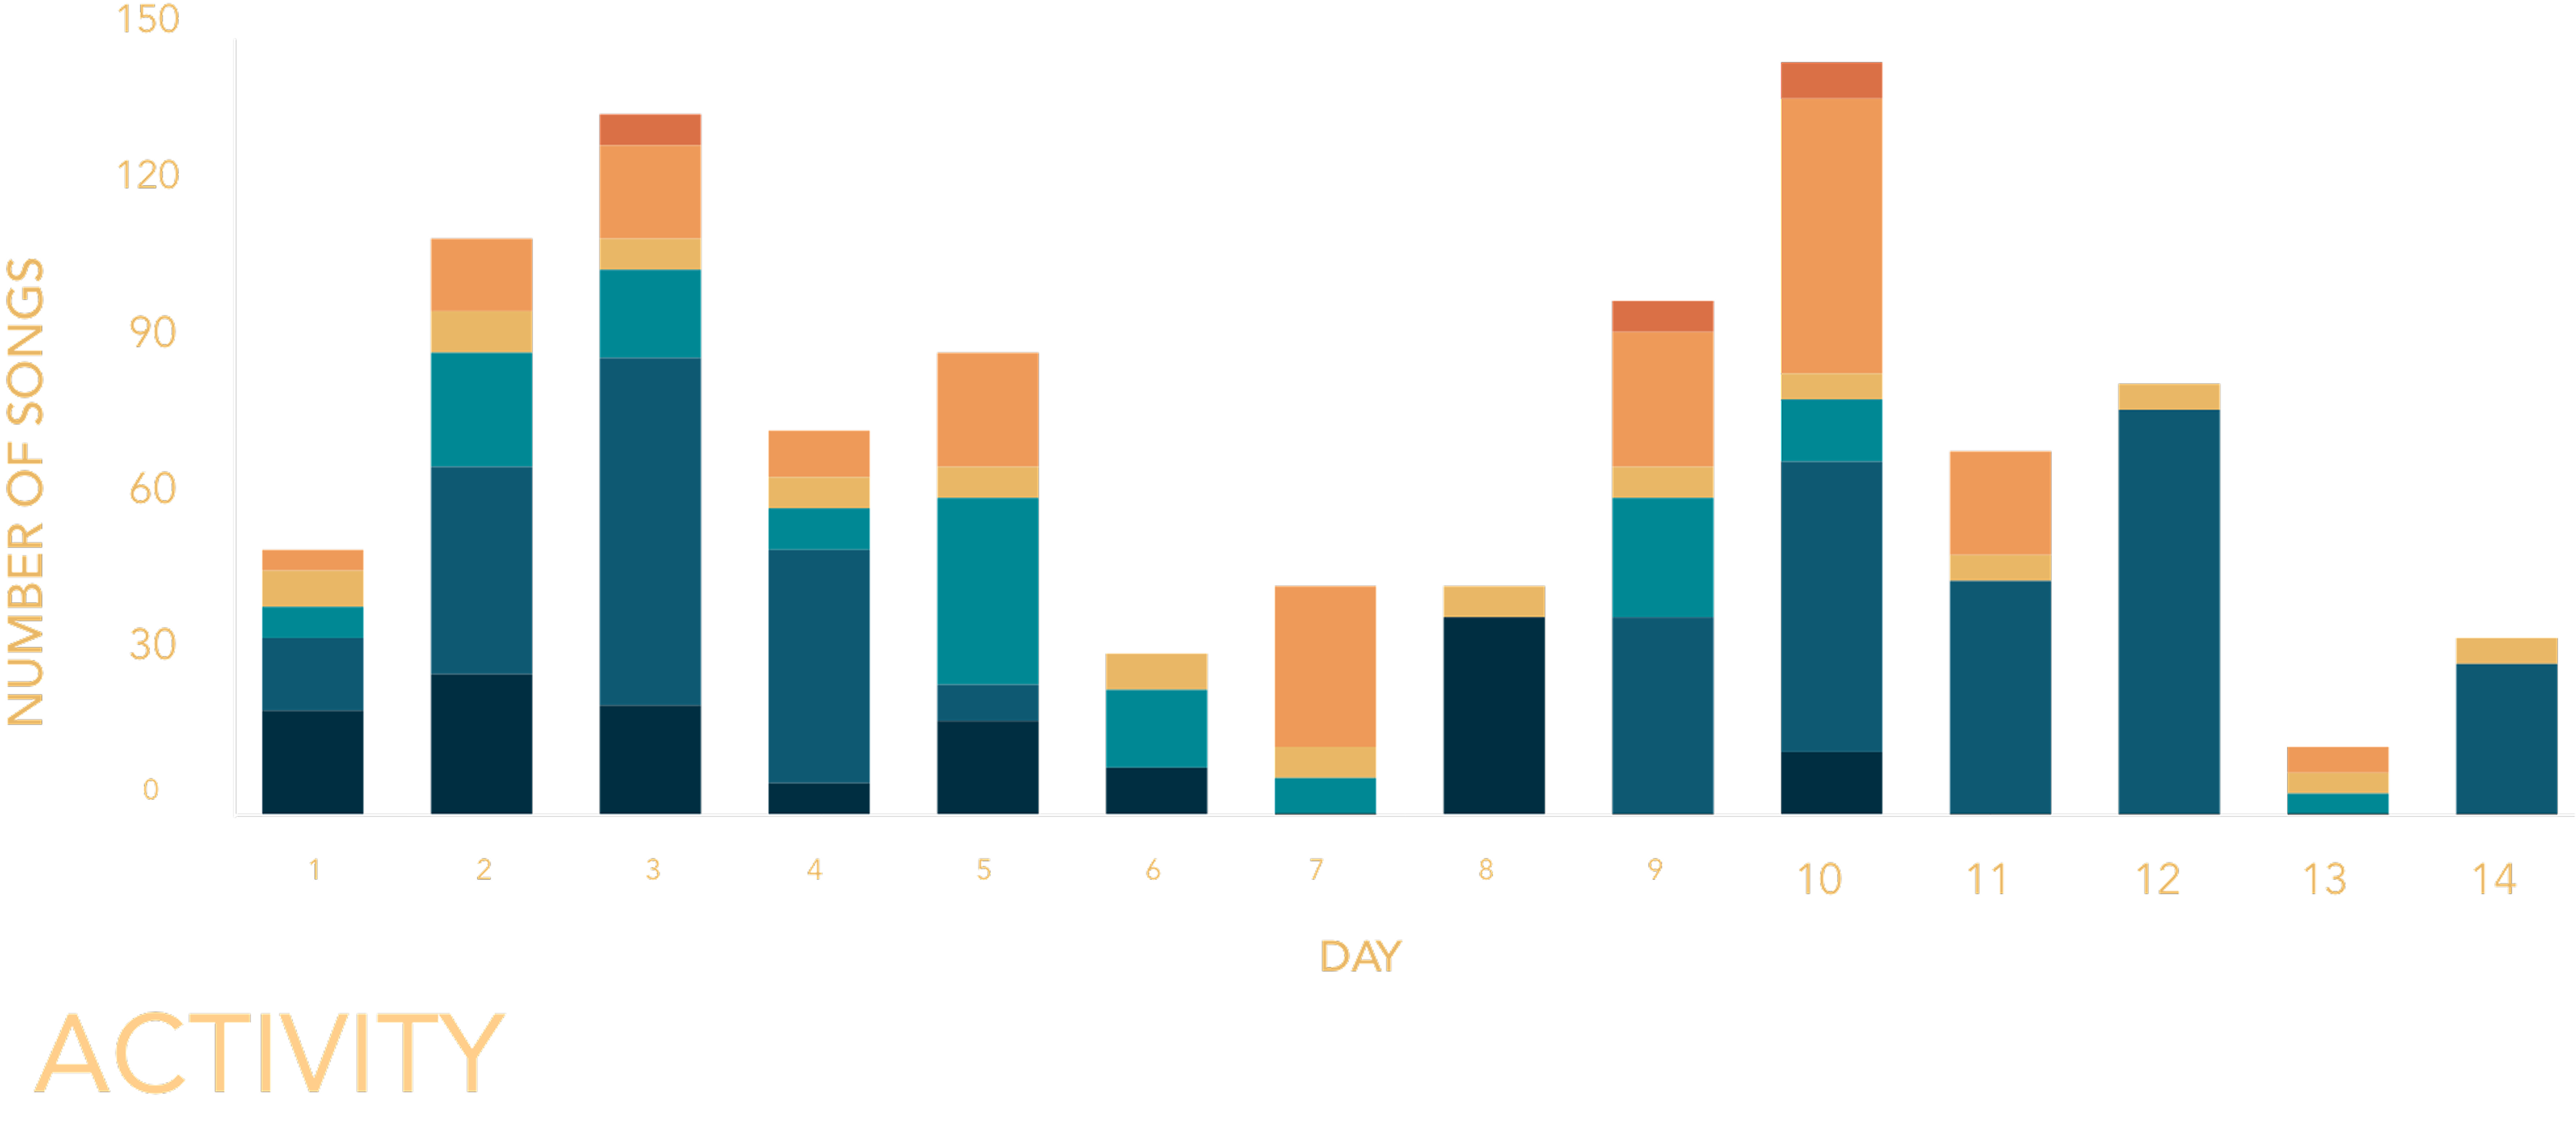
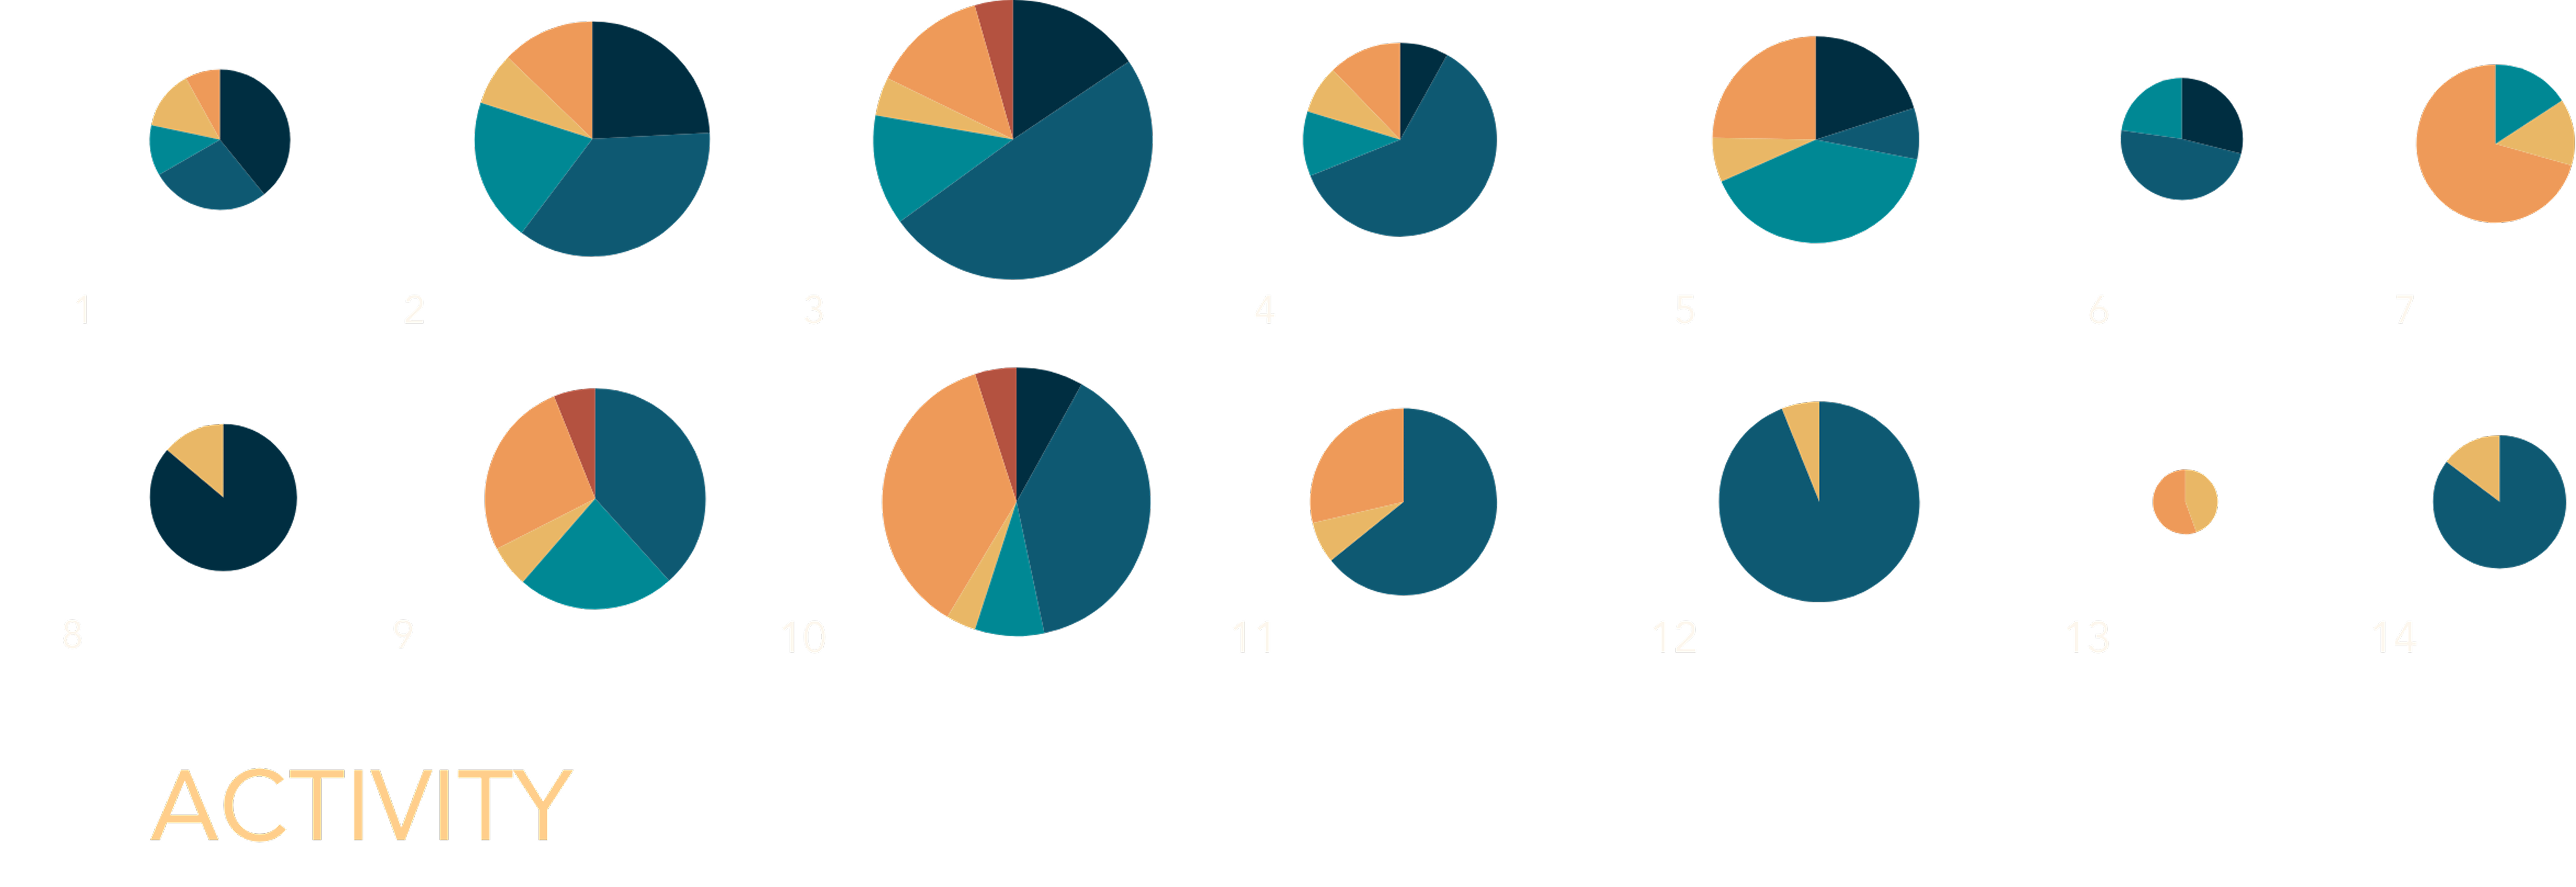
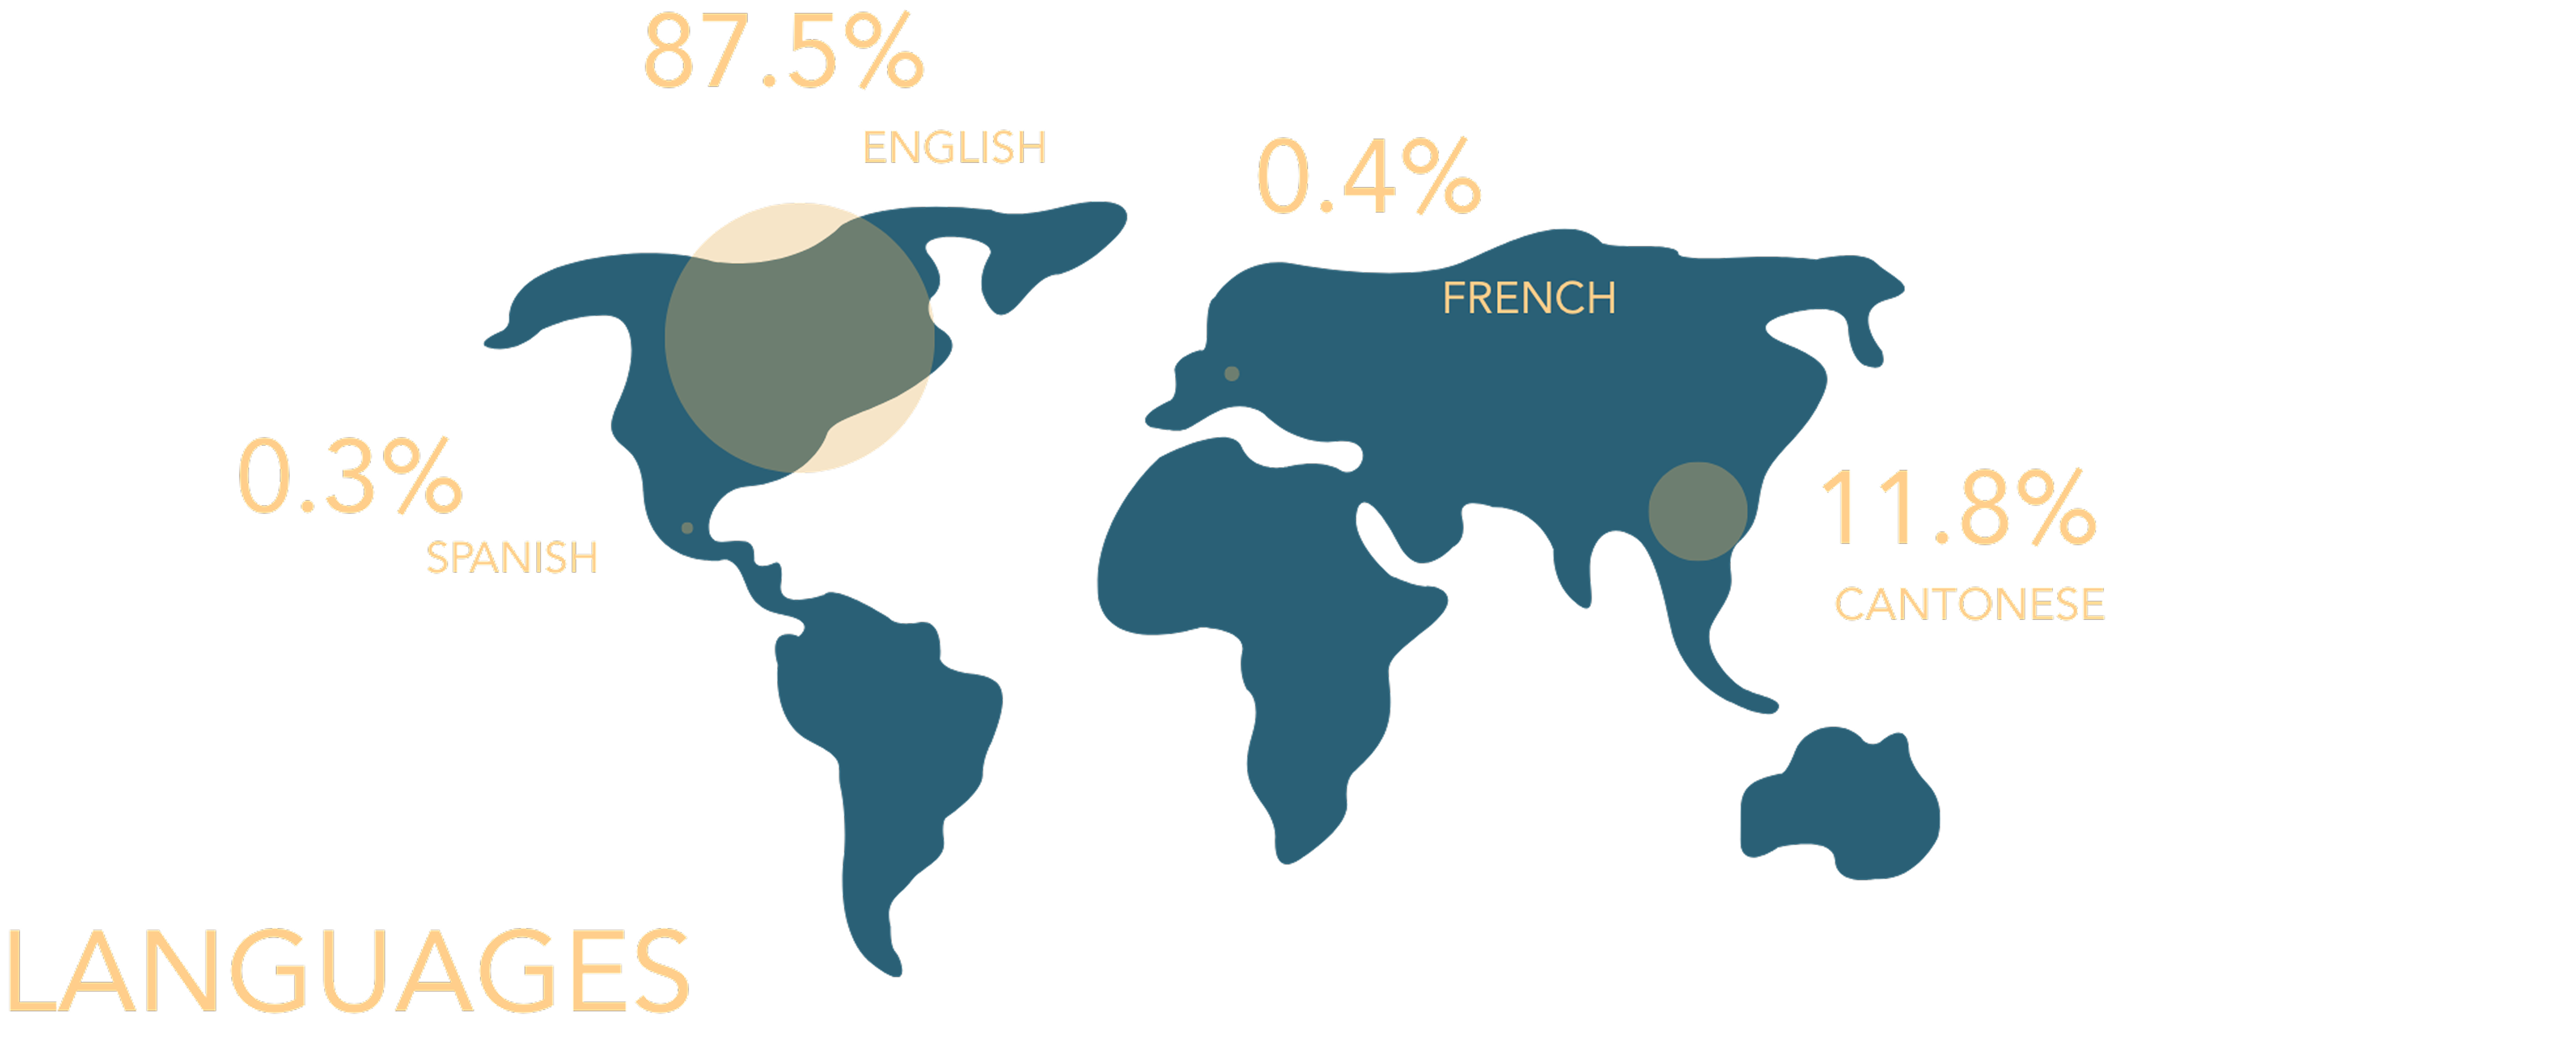
data visualization in the form of an infographic depicting self-collected data of music and play time over the course of 14 days.
typography
colour pallete